.svg)


This is the second article of this mini-series, where we share our journey from measurement to movement. In the first article, Measuring What Matters, we explained why it’s important to measure and how we did it. In this article, we will reveal what our CO₂ emissions are telling us, and in the last article we will explain how we can use this baseline to improve for the future.
In 2025, after months of collecting and analyzing data, we received the results of our first full carbon footprint assessment: our 2024 baseline. Conducted by Fair Venture (former ImpactMetrics), the report gave us something we’ve never had before: a data-driven picture of ExpatRide’s total environmental impact.
Numbers don’t tell the whole story, but they do reveal where change can start.
What the Data Shows
Our total CO₂ emissions for 2024 amounted to 1,353 tons of CO₂e.
While that number on its own can sound abstract, it becomes meaningful once we look at where those emissions come from and what they represent.
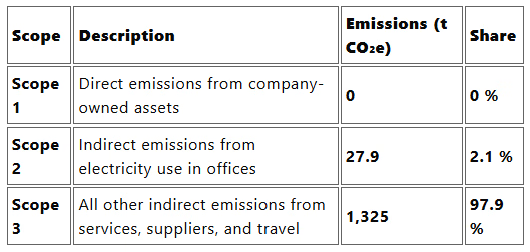
The message is clear: almost all our emissions come from Scope 3, which is our indirect services.
Let’s dive deeper into it!
No Scope 1 emissions were found. These are usually emissions from company-owned assets such as company cars and company-owned facilities.
The 2.1% of our emissions come from Scope 2, which are stemming from purchased electricity in our offices.
The majority of our emissions are in Scope 3 emissions, amounting to 97.9%. Within scope 3, there are three main areas the emissions come from:
The remaining small portion comes from employee commuting and office operations.
What does these numbers mean?
These results confirm what we long suspected: our biggest impact lies beyond our own offices, in the mobility services we coordinate.
Only about 7 % of total emissions are linked to our direct operations. This means, that whenever a client requests a service, only 7% of the emissions is added from ‘our’ end. The reason the footprint is relatively small, is because ExpatRide doesn’t own or operate fleets of vehicles that sit idle. We only contract the cars, drivers, and services that are actually needed. This model minimizes waste and ensures that every kilometer driven serves a specific purpose. You could say, that the cars are the elephant and ExpatRide is just a fly. Clients could of course coordinate cars on their own, but our data shows that the extra emissions added by ExpatRide’s involvement are minimal. The “cost” of involving us is not environmental; it’s actually the opposite. By working through us, clients benefit from optimized mobility, better supplier selection, and initiatives like our EcoRide program: all of which help reduce emissions over time.
That said, a smaller operational footprint doesn’t mean we can’t do better, we definitely can, and we will.
For the remaining 93% of our footprint, it lies within our value chain, the services we coordinate for clients and the suppliers we work with. This insight shows that it is not only an internal effort; it’s a shared responsibility across clients, partners, and suppliers.
Reducing emissions now depends on collaboration, education, and smarter choices, such as:
Putting it into Perspective
Data alone doesn’t create change, but it makes progress measurable.
To make the numbers more tangible, we can also look at our emissions in relative terms:
By translating total emissions into these relatable indicators, we gain a clearer understanding of our performance and progress. They allow us to track improvement year over year, see how changes in operations affect our footprint, and benchmark against industry standards as more companies begin reporting their CO₂ data.
Our 2024 report gives us a foundation , a clear starting point for reduction and innovation.
It also highlights the importance of collaboration: our footprint is closely tied to our partners’ and clients’ footprints. When they make greener choices, we all move forward.
Read the next article to discover how we’re turning these insights into concrete actions, and what that means for you and your environmental impact.
Image credits
Photo by ledinhlinh1495 at FreePik
.svg)


